The previous artifact in this series focused on Power Platform governance.
It showed how a Power Platform asset could be inspected through native administration: inventory, ownership, environment placement, connectors, usage, run history, and environment boundary.
That was an important step.
But governance does not stop at the platform layer.
The next question is:
How does a governed environment support real project or program delivery?
That is the purpose of this artifact.
This checkpoint moves from platform governance into delivery control. It uses a mock program, built inside Microsoft Project, Planner Premium, Dataverse-backed resource structures, and reporting surfaces, to show how work can be made more visible, accountable, and governable.
The goal is not to present a finished production system.
The goal is to demonstrate a working control model.
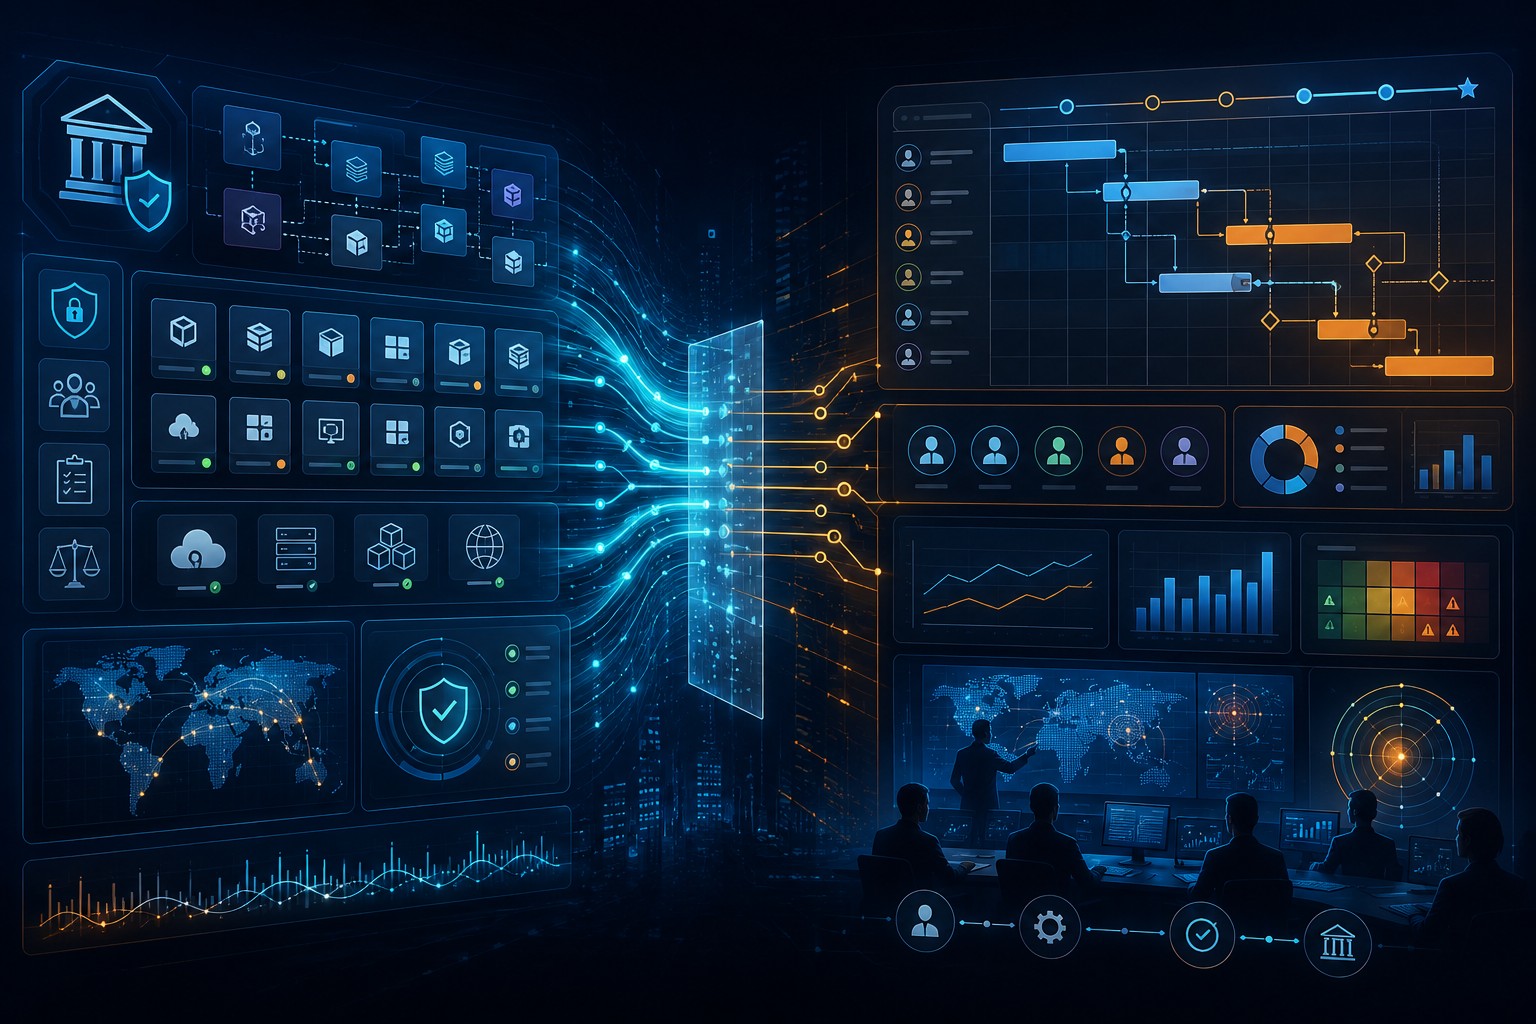
A modern PMO does not only track tasks. It connects work, people, roles, systems, schedules, dependencies, and reporting into a control model that makes delivery visible, governable, and executable.
______________________________________________________________________________________________________________________
Why This Artifact Exists
Complex work rarely fails because one person forgot one task.
It often fails because the control model is weak.
Schedules exist in one place.
Risks exist somewhere else.
Decisions are buried in meetings.
Approvals happen in email.
Resources are tracked separately.
Dependencies are understood informally.
Reporting is assembled manually.
That creates a familiar delivery problem:
The work is happening, but the control environment around the work is fragmented.
Artifact 2 showed how platform assets can be inspected and accounted for.
This artifact asks a broader delivery question:
Can the same governance thinking be applied to project delivery?
In other words:
• Who owns the work?
• What role are they playing?
• What phase is the work in?
• What dependencies exist?
• What milestones or gates control progress?
• What resources are assigned?
• What reporting can be produced from the model?
• Where does the work actually live?
That is where platform governance and PMO oversight begin to converge.
______________________________________________________________________________________________________________________
The Mock Program
For this demonstration, I created a mock project plan called:
A fictional organization is expanding its service operations across additional locations and service areas. In a real delivery environment, that kind of expansion is not only about opening new locations. It can also involve people, vendors, finance controls, reporting, approvals, site readiness (construction/expansion), operational readiness, platform enablement, and the upgrading or re-planning of the systems that support the work.
That is the type of delivery pattern Manage Your Tech is built to understand: not only the project plan, but the systems, resources, dependencies, and control layers behind it.
The program is intentionally fictional, but the delivery pattern is realistic.
The purpose of the mock program is to show how this type of work can be structured and controlled when many moving parts need to be coordinated at the same time. The example creates a practical setting for planning the work, assigning resources, sequencing dependencies, managing readiness, tracking progress, and connecting delivery activity to reporting and governance.
It includes:
• internal stakeholders
• supporting contractor resources
• workstreams
• dependencies
• phases
• gates
• milestones
• resource assignments
• effort tracking
• reporting views
The plan is structured as a federal-aligned five-gate demonstration model. Public Services and Procurement Canada describes its Project Navigator framework as being made up of five distinct phases and gates, and I used that general concept as a reference point for structuring this mock program. 1
This is not an official Government of Canada template; it is a lab model aligned to the idea of gated public-sector delivery control.
The five phases used in the schedule are:
1. Initiation
2. Planning
3. Definition
4. Execution
5. Close-out
Each phase creates a control point before the next phase proceeds. That matters because gates are not just schedule markers. They represent readiness, evidence, review, decision-making, and accountability.
______________________________________________________________________________________________________________________
The Delivery Problem
In many project environments, the schedule is treated as a planning artifact.
That is useful, but not enough.
A schedule becomes more valuable when it connects to:
• ownership
• resource capacity
• workstream accountability
• decision points
• dependencies
• risk and issue escalation
• approval gates
• reporting cadence
• delivery readiness
• operational handoff
This is where PMO discipline matters.
The PMO is not only asking whether the project has tasks.
The PMO is asking whether the work can be controlled.
That means understanding not only what work is planned, but how the work moves, who owns it, what systems support it, and what evidence is available when decisions need to be made.
______________________________________________________________________________________________________________________
The PMO Control Model
The mock Regional Service Expansion Program was built around several control layers.
These include:
• schedule structure
• phase and gate logic
• milestone control
• dependency management
• resource assignment
• stakeholder ownership
• role-based delivery capacity
• reporting visibility
• escalation and decision points
• platform-supported workflow assumptions
The important point is not that every task is complex.
The important point is that each task exists inside a control model.
A task is not just a line in a schedule.
It has a phase.
It has timing.
It has dependencies.
It has ownership.
It may have a resource or role.
It may support a gate decision.
It may connect to a platform process, report, or workflow.
That is the difference between task tracking and delivery control.
______________________________________________________________________________________________________________________
The Schedule Layer
The first layer of the demonstration is the Microsoft Project schedule.
The schedule includes the five major phases, detailed tasks, dependencies, milestones, and a visible critical path. It begins with initiation and moves through planning, definition, execution, and close-out.
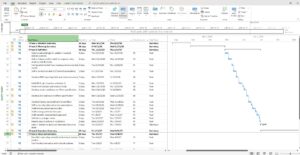
Figure 1 — MS Project schedule and critical path
The MS Project view shows the federal-aligned phase structure, task sequencing, dependencies, milestone logic, and critical path behavior for the Regional Service Expansion Program.
The schedule layer makes the work visible as a structured delivery model.
It shows:
• when work starts
• how long tasks take
• what tasks depend on other tasks
• where phase gates occur
• where the critical path flows
• when the project is expected to finish
• where delivery logic needs attention
This is important because complex work needs sequencing.
Without sequencing, every task can appear equally urgent.
With sequencing, the PMO can see which tasks carry delivery impact, which tasks support later work, and which milestones control progress.
The schedule is not the whole control environment. But it is the backbone.
______________________________________________________________________________________________________________________
The Federal-Aligned Gate Structure
The mock plan uses gates as decision points.
In this model, the gates are used to pause, review, and confirm whether the program is ready to proceed.
For example:
• Gate 1: confirms that initiation is complete and planning can begin.
• Gate 2: confirms that planning is sufficient to move into definition.
• Gate 3: confirms that definition work is complete enough to authorize execution.
• Gate 4: confirms readiness for close-out and transition.
• Gate 5: confirms final close-out and control handoff.
This matters because gated delivery provides structure.
A gate is not only a date.
It is a question:
Is the evidence strong enough to proceed?
That evidence may include:
• scope clarity
• stakeholder alignment
• readiness criteria
• resource availability
• risk position
• decision records
• cost or finance controls
• platform or reporting readiness
• operational handoff planning
In a public-sector or enterprise environment, this kind of structure helps prevent delivery from becoming informal or personality-driven.
The control point creates discipline.
______________________________________________________________________________________________________________________
The Resource and Role Layer
The second major layer is resource traceability.
The program includes internal stakeholders and external contractor resources.
Internal stakeholders include:
• Vanan Nages — PMO / Governance Lead
• Sarah Chen — Supply Chain / Vendor Lead
• Arjun Nair — Operations / Deployment Lead
• James Patel — Finance / Controls Lead
Supporting contractor resources include roles such as:
• Solution Architect
• Change & Training Lead
• Data / Reporting Analyst
• QA / Test Lead
• Procurement Specialist
• Security / Privacy Advisor
• Business Analyst
This structure matters because delivery control depends on knowing both who is involved and what function they serve.
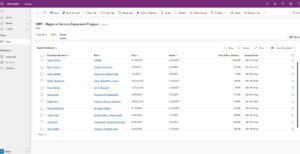
Figure 2 — Team / Bookable Resources view
The project team view shows named resources, role categories, effort, start dates, finish dates, and resource traceability across internal stakeholders and supporting contractor roles.
This is one of the most important parts of the model.
The project team is not just a list of names.
It links:
• people
• roles
• dates
• effort
• assignments
• workstreams
• delivery accountability
In Dataverse-backed project environments, this becomes especially important because resources and roles are not only labels typed into a schedule. They can become structured data that supports reporting, filtering, ownership review, and project governance.
Microsoft explains that premium Planner plans, formerly Project for the web, use Dataverse-backed data, and existing Project for the web data remains accessible in Dataverse for Power Platform connectors and reporting scenarios such as Power BI. 2
That is why resource traceability matters.
It allows the project model to describe not only what work exists, but who is connected to it and what role they are playing.
______________________________________________________________________________________________________________________
The People View
The next layer is the People view in Planner / Project.
This view organizes tasks around named resources.
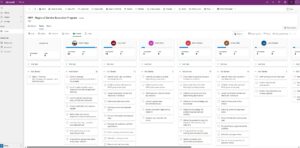
Figure 3 — People view
The People view groups project tasks by assigned resource, showing how work is distributed across internal stakeholders and supporting contractor resources.
This view is useful because it shifts the question from:
What tasks exist?
To:
Who is carrying the work?
That is an important PMO question.
A schedule can look complete while the work is unevenly distributed.
A resource can appear assigned while carrying too many critical tasks.
A stakeholder can appear involved but have no clear accountability.
The People view helps reveal whether ownership is actually visible.
In this demonstration, the People view shows how the mock program distributes tasks across PMO leadership, supply chain, operations, finance, solution architecture, reporting, training, QA, procurement, and other support roles.
That is delivery visibility.
______________________________________________________________________________________________________________________
The Planner / Project Web Layer
The project also appears in the browser-based Microsoft planning surface.
This is important because delivery control should not be trapped only inside the desktop schedule file.
The plan can also be viewed through task, timeline, people, chart, and team surfaces.
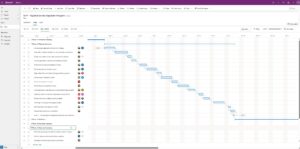
Figure 4 — Planner / Project timeline view
The timeline view shows the program schedule in a browser-based planning surface, making phases, tasks, assignments, and sequencing visible outside the desktop project file.
The browser view supports a different kind of access.
Executives, stakeholders, and delivery participants may not all work directly inside Microsoft Project desktop.
They may need to see:
• task status
• timelines
• ownership
• assignments
• charts
• people views
• team structure
That is where the project model becomes more accessible.
The desktop schedule provides detailed planning control.
The web surface provides broader delivery visibility.
Both matter.
______________________________________________________________________________________________________________________
The Chart and Reporting Layer
The next layer is reporting.
Planner charts provide an immediate view of task status, bucket distribution, and effort by person.
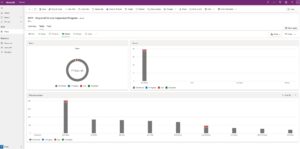
Figure 5 — Planner charts view
The chart view shows project status, task distribution, and effort by person, creating a basic reporting layer from the project model.
This is not a finished executive dashboard.
It is an early visibility layer.
But even this simple view is useful because it begins to show:
• how many tasks remain
• whether tasks are late
• where effort is concentrated
• who carries the largest workload
• whether the project is mostly not started, in progress, late, or complete
That kind of visibility helps the PMO ask better questions.
For example:
• Why does one resource carry more effort than others?
• Are late tasks concentrated in one workstream?
• Are tasks grouped properly?
• Is the work still aligned to the intended delivery model?
• Does the reporting view match what leadership needs to see?
A reporting layer is not only about charts.
It is about creating a feedback loop.
The schedule creates the plan.
The resource model creates accountability.
The reporting layer shows whether the plan is becoming visible enough to govern.
______________________________________________________________________________________________________________________
Power BI as an Oversight Layer
The Power BI view introduces another reporting possibility.
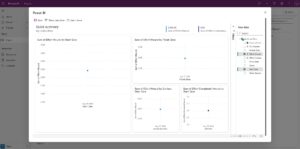
Figure 6 — Power BI quick summary
The Power BI quick summary demonstrates how project effort, dates, and status data can begin moving into a visual reporting layer.
This is an early view, not the final dashboard. But it proves the direction.
Because this is a mock program at the model-building stage, the Power BI view is intentionally early. The purpose is not to present a finished executive dashboard, but to show that structured project data can begin moving into a reporting surface.
The project data can be surfaced into reporting. Effort, start dates, finish dates, completion fields, and status information can become part of a visual oversight model.
Microsoft’s support documentation describes connecting Power BI Desktop to Project data through the Dataverse instance where Project web app data is stored. 3
That matters because PMO reporting should not always require manual assembly.
If schedule, resource, and status data can be structured properly, then reporting can become more repeatable.
That does not remove the need for interpretation.
But it gives the PMO a stronger evidence base.
______________________________________________________________________________________________________________________
The Platform Connection
This artifact builds directly on the previous one.
Artifact 2 focused on Power Platform governance.
That artifact asked whether an asset could be seen, inspected, accounted for, and understood through:
• inventory
• ownership
• connectors
• usage
• run evidence
• environment boundary
• lifecycle considerations
Artifact 3 now shows how that same mindset applies to delivery.
Apps, flows, Dataverse records, resource models, schedules, and reports are not separate from the work.
They are often where the work lives.
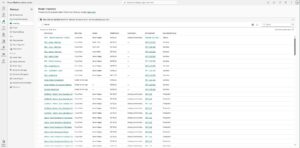
Figure 7 — Platform governance connection.
The Power Platform Admin Center inventory view connects the delivery model back to governed platform assets, including flows, ownership, environment placement, and administrative visibility.
This view connects the delivery-control model back to the governance layer. The project schedule shows phases, dependencies, resources, milestones, and ownership, while the Power Platform inventory shows where supporting work assets can be inspected and accounted for.
Intake, routing, readiness, reporting, and stakeholder-owned flows are not just technical objects. They can become part of the operating model that delivery governance needs to understand.
A schedule may show when work should happen, but the platform layer can show where parts of that work live, who owns them, what environment they belong to, and how they may support the delivery process.
For example:
• an intake flow may represent how new work enters the system
• a routing flow may represent how requests move to the right owner
• a readiness tracker may represent operational preparedness
• a finance workflow may represent approval control
• a dashboard may represent executive visibility
• a project schedule may represent timing, dependencies, and ownership
• a resource model may represent capability and accountability
This is why PMO oversight increasingly depends on platform understanding.
A PMO that cannot understand these surfaces may struggle to govern the work those systems carry.
______________________________________________________________________________________________________________________
What This Proves
This checkpoint proves something practical.
It does not prove that the Regional Service Expansion Program is a real production program.
It does not claim that every reporting layer is final.
It does not claim that every governance control is fully configured.
What it proves is this:
A delivery-control model can connect schedule structure, resource traceability, role-based ownership, platform context, and reporting visibility.
That is a meaningful proof point.
The model shows that complex delivery can be made more visible through:
• structured phases
• gate decisions
• task dependencies
• critical path logic
• internal stakeholder ownership
• contractor resource capacity
• role/category traceability
• web-based planning views
• chart-based status visibility
• Power BI reporting potential
This is the bridge from governance/oversight to delivery control.
1. Artifact 2 showed that systems can be accounted for.
2. Artifact 3 shows that those systems can support delivery oversight.
______________________________________________________________________________________________________________________
Why This Matters Beyond the Lab
In real organizations, project work rarely lives in one place.
A project may have:
• a schedule in Microsoft Project
• tasks in Planner
• workflows in Power Automate
• data in Dataverse
• files in SharePoint
• approvals in Teams or Outlook
• reports in Power BI
• governance controls in Power Platform Admin Center
• identities and access in Entra
• decisions captured in meetings, RAID logs, or status reports
• collaboration/connection with other systems/environments (ex. GitHub, confluence, Jira, Smartsheet, DEV environments)
If those surfaces are disconnected, PMO oversight becomes harder.
If they are structured, the PMO can see more. That does not mean the PMO becomes purely technical. It means the PMO understands the systems that carry the work.
That is an important distinction.
The PMO still needs judgment, communication, facilitation, escalation, and leadership.
But those skills become stronger when supported by a visible control environment.
______________________________________________________________________________________________________________________
The PMO Position
This is the position the artifact is intended to demonstrate:
I am not only managing work.
I am helping build the control environment around complex work.
That control environment includes people, roles, schedules, dependencies, systems, governance questions, and reporting surfaces.
The PMO is not just asking for updates.
The PMO is asking:
• Where does the work live?
• Who owns it?
• What role are they playing?
• What does this work depend on?
• What gate or milestone does this support?
• What happens if it is late?
• What system carries the evidence?
• What should leadership see?
• What needs escalation?
• What should be governed, documented, or handed off?
That is delivery control.
______________________________________________________________________________________________________________________
How This Builds on the MYT Governance Lab
The MYT Governance Lab began with Power Platform visibility. The earlier work showed how a CoE dashboard could help surface makers, apps, flows, environments, and ownership patterns.
The next step showed how native Power Platform Admin Center views could inspect individual assets and environments.
This artifact extends that work again. Now the focus is delivery.
The question is no longer only:
Can the platform asset be governed?
The question becomes:
Can governed assets, resources, and schedules support delivery control?
That is the progression.
CoE visibility becomes native governance.
Native governance becomes delivery control.
Delivery control becomes a way to make complex work visible, governable, and executable.
______________________________________________________________________________________________________________________
Closing Thought
Modern delivery control is more than project tracking.
It is more than a schedule, and more than a dashboard.
It is the ability to understand how work moves across people, systems, roles, dependencies, gates, approvals, and reporting layers.
A modern PMO does not simply track tasks.
It understands where work lives, how it moves, who owns it, what systems support it, and what controls are needed to keep delivery visible and executable.
That is the purpose of this artifact.
The Regional Service Expansion Program is a mock model. But the control pattern is real.
The work becomes more governable when it can be seen.
The work becomes more executable when it can be structured.
And the work becomes more resilient when the systems carrying it can be understood, accounted for, and connected.
________________________________________________________________________________________________
[1] Reference text:
Public Services and Procurement Canada, “Project Navigator.” PSPC describes Project Navigator as its project management framework and notes that it is made up of five distinct phases and gates, with each gate corresponding to a decision point.
[2] Reference text:
Microsoft Support, “Frequently asked questions about Microsoft Planner.” Microsoft explains that Project for the web has transitioned into Planner and that data previously in Project for the web remains accessible in Dataverse for customers using Power Platform connectors, including Power BI reporting.
[3] Reference text:
Microsoft Support, “Use Power BI Desktop to connect with your Project data.” Microsoft describes connecting to the Microsoft Dataverse instance where Microsoft Project web app data is stored when using the Project Power BI template.