How plan, progress, variance, readiness, and risk become visible in complex delivery environments
In From Delivery Activity to Delivery Outcomes, the section on Controlling the work mentioned EVM and EVMM-style tracking as one of the practical tools behind MYT’s delivery-control outputs, without stopping to unpack it. This post is that unpacking — one more piece on the proof shelf, going one level deeper into what those two terms actually mean and what they look like in practice.
What EVM actually is
Earned Value Management (EVM) is a formal, decades-old project-controls methodology, standardized in the U.S. under ANSI/EIA-748 and used widely across government, defense, and large capital programs.
At its core, EVM compares three numbers at any point in a project: what you planned to have done by now (Planned Value), what you’ve actually completed, expressed in the same planned terms (Earned Value), and what it actually cost to get there (Actual Cost).
From those three numbers, EVM derives the variances and indices most PMO professionals will recognize:
• Schedule Variance (SV) = Earned Value − Planned Value
• Cost Variance (CV) = Earned Value − Actual Cost
• Schedule Performance Index (SPI) = Earned Value ÷ Planned Value
• Cost Performance Index (CPI) = Earned Value ÷ Actual Cost
• Estimate at Completion (EAC) — typically Budget at Completion ÷ CPI
The ANSI/EIA-748 standard organizes this into 32 guidelines across five categories — organization, planning and budgeting, accounting, analysis and reporting, and revisions — so a program’s numbers can be trusted, audited, and compared.
That’s EVM: a real, citable, compliance-grade discipline. Nothing about it is ours to redefine.
______________________________________________________________________________________________________________________
What MYT means by EVMM
EVMM, as MYT uses the term, stands for Earned Value Management Manager — literally, the manager of your EVM. Where EVM is the discipline (the vocabulary of plan, progress, variance, and confidence), EVMM is what we build: the workboard, the WBS structure, the status and progress tracking, the ownership fields, the rollups, and the dashboard that turn that discipline into something a delivery team actually runs on every week.
Worth being precise here so we’re not stepping on anyone else’s term: EVMM is not the Earned Value Management Maturity Model (EVM3®, published through PMI), which is a separate, formal framework for assessing how mature an organization’s certified EVM system is. That’s a different tool for a different job. What we call EVMM is simpler and more operational — it’s not a maturity scorecard, it’s the running system itself.
Activity is not always progress
A project can have frequent meetings and still lack control. A team can update tasks and still not have a reliable view of delivery health.
A dashboard can exist and still fail to answer the most important questions: Is the work moving according to plan? Which workstreams are behind? Which activities are complete, incomplete, blocked, or pending validation? Where has the schedule shifted? What changed from the last reporting cycle? Which risks are now affecting delivery? What requires leadership attention?
Without a structured way to compare plan, progress, variance, and readiness, delivery reporting can become descriptive rather than useful — it explains what happened, but doesn’t clearly show what needs to happen next. EVM-style visibility helps shift reporting from status narration to delivery control.
Why this matters in IT and systems work
Complex technology programs are rarely simple task lists. They may involve ERP, CRM, SaaS, MRP, Oracle Cloud Infastructure (OCI), Microsoft 365, Power Platform, Dataverse, Power BI, infrastructure, data migration, identity, cybersecurity-adjacent governance, vendor coordination, user acceptance testing, operational readiness, and cutover planning — often spanning departments, regions, vendors, and technical teams at once.
In those environments, delivery control has to do more than track dates. A migration tracker needs to show baseline scope, current progress, validation status, reconciliation gaps, open actions, ownership, blockers, and readiness. A program dashboard needs to show task completion, workstream variance, milestone movement, overdue items, resource pressure, and executive-level status. A cutover plan needs to show not only timing, but dependency logic, readiness criteria, decision gates, rollback considerations, and stakeholder alignment.
______________________________________________________________________________________________________________________
What this looks like as an EVMM engine
On one recent ERP cutover engagement (details fictionalized to protect client confidentiality, but the structure below is real), the EVMM MYT built and ran looked like this: a master database of over 2,400 rows tracking more than 1,400 discrete cutover tasks, organized under a work-breakdown structure capable of rolling up through multiple levels, split across four SAP-aligned functional areas — manufacturing, procurement (source-to-pay), order-to-cash, and record-to-report.
Every task carried both a baseline and an actual start/finish date, a named owner, a country, and a status. Those fields rolled up automatically into a live dashboard showing completion percentage by owner, this week against last week, with no manually re-typed totals.
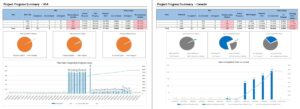
Redacted EVMM dashboard: plan-vs-actual progress, variance, and completion by owner.
That’s the difference between a task list and an EVMM: the task list tells you what’s happening. The Manager of your EVM tells you what’s happening compared to what was planned, who owns the gap, and whether it’s closing or widening.
Not every environment needs formal EVMS
It’s important to be precise here. A formal Earned Value Management System may be required in certain government, defense, engineering, construction, or large-scale capital environments, where defined standards, contract requirements, and compliance expectations already exist. That’s different from saying every project needs formal EVMS.
Many IT and systems-integration environments need something more practical: an EVM-informed control layer that helps teams compare planned work, actual movement, remaining work, variance, readiness, and risk — including the kind of two-day lookahead and lookback cadences that keep a fast-moving cutover honest between formal reporting cycles.
For some projects, that means a lightweight plan-vs-actual dashboard. For others, a structured baseline-and-variance model. For troubled programs, it means recovery reporting that shows what changed, what remains unstable, and what must be corrected before the next milestone. For executive stakeholders, it means a simplified delivery summary that translates detailed project movement into decisions, risks, and required action.
An EVMM should support delivery. It should not become noise.
______________________________________________________________________________________________________________________
The dashboard is not the EVMM by itself
A dashboard is only useful when the underlying delivery structure is sound. The value doesn’t come from charts alone — it comes from the relationship between the plan, the work, the data, the reporting cadence, and the decisions being supported. A useful EVMM needs to understand what the project is trying to deliver, how the work is structured, which milestones matter, which dependencies affect sequencing, how progress is measured, what variance means, who owns the next action, and what leadership needs to decide.
Without that structure, dashboards can decorate project data without improving delivery control. With it, they become a control surface — helping stakeholders move from “what is happening?” to “what does this mean, what requires attention, and what should happen next?”
Where MYT fits
Manage Your Tech, Ltd. supports complex IT delivery environments where scope, systems, governance, reporting, and delivery controls need to be made visible and executable.
In the context of EVM / EVMM-style visibility, that means translating delivery activity into practical outputs: WBS structures and MS Project plans, baseline and re-baseline support, plan-vs-actual progress views, workstream dashboards, variance tracking, milestone and readiness reporting, recovery and stabilization views, Power BI / Dataverse reporting concepts, and executive summaries that connect technical work to business visibility.
The objective isn’t more reporting for its own sake. It’s a clearer operating layer — one that shows what was planned, what has moved, what remains pending, where delivery is drifting, and what decisions are needed to keep the work moving forward.
From reporting to control
EVM / EVMM-style visibility isn’t only about measurement. It’s about delivery confidence. When plan, progress, variance, readiness, and risk are visible, teams can have better conversations, leaders can make better decisions, workstreams can be corrected earlier, and recovery plans can be built from evidence rather than assumption.
That’s the difference between reporting activity and controlling delivery — and it’s the same difference this series keeps coming back to, from CoE visibility, to native governance, to delivery control, to this: EVM as the discipline, EVMM as the manager that runs it.
______________________________________________________________________________________________________________________
Sources:
- From Delivery Activity to Delivery Outcomes — MYT
- EIA-748-D — Humphreys & Associates
- NDIA IPMD EIA-748 EVMS Intent Guide
- PMI — Earned Value Management: Reading the Numbers
- PMI — The Earned Value Management Maturity Model (EVM3®)
______________________________________________________________________________________________________________________