In Part 1, I outlined what a Power Platform Center of Excellence (CoE) actually is — not as a toolkit, but as an operating model for governance, visibility, and control.
At the time, that perspective was largely conceptual.
Since then, I’ve stood up a working CoE environment inside my own Microsoft tenant — and what’s become clear is this:
A CoE is not something you “build once.”
It’s something that begins quietly… and then starts revealing patterns.
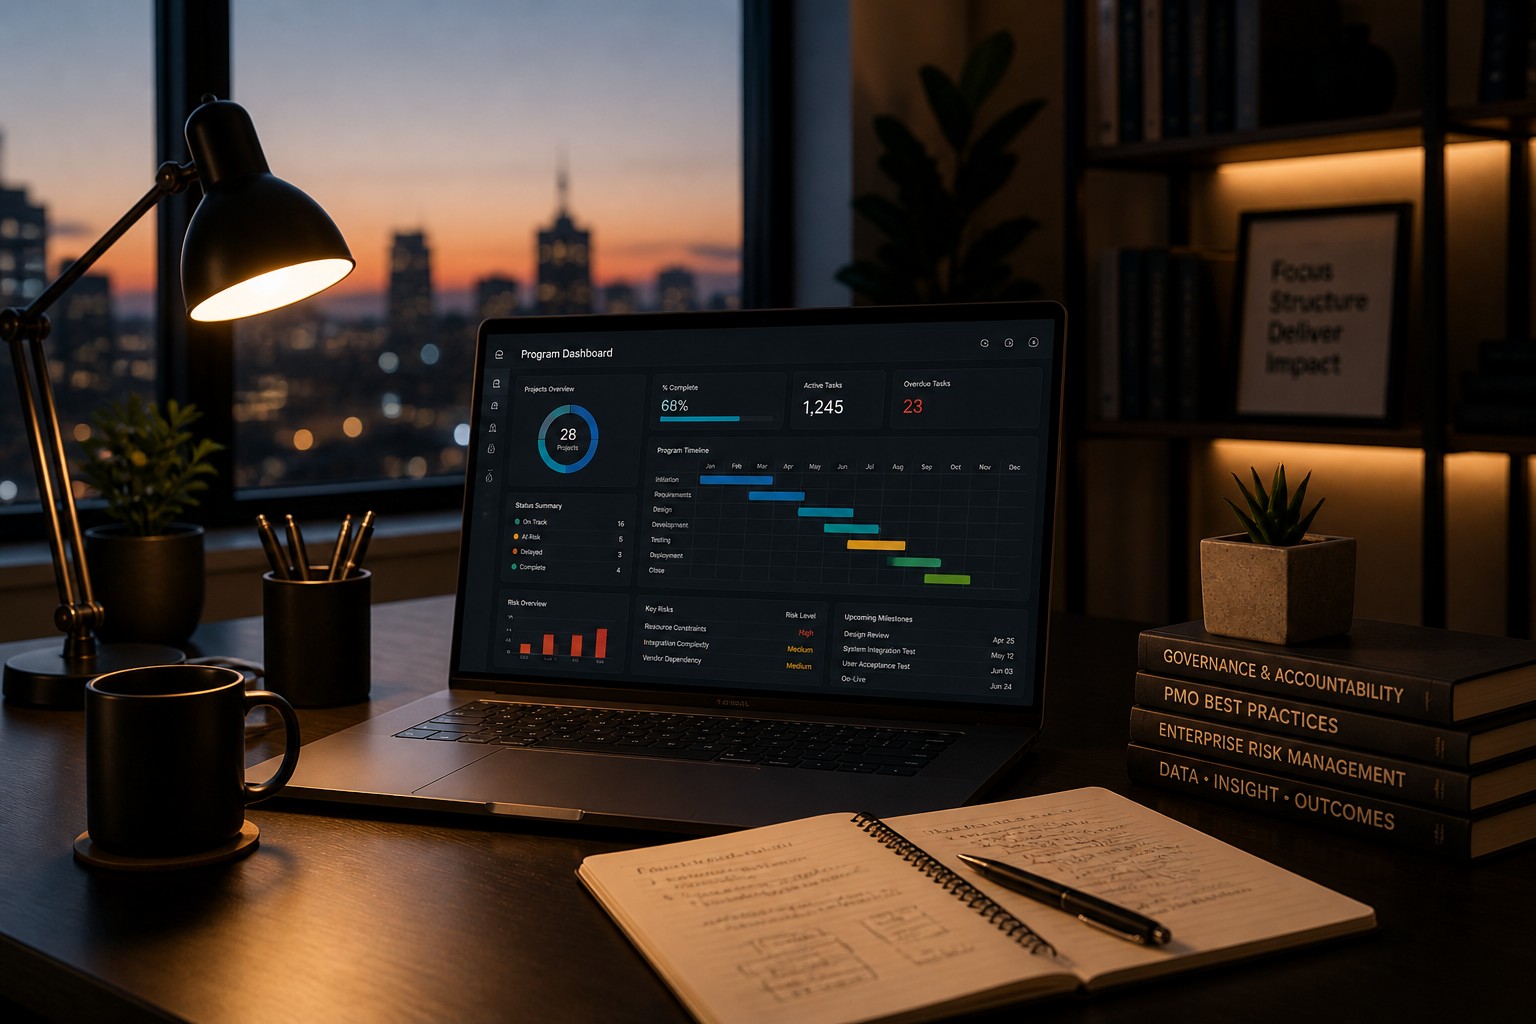
In many ways, this kind of environment behaves like a telemetry monitor — not unlike those used in healthcare — continuously surfacing signals that help us understand the health of the system in real time
From Setup to Signal
The environment I’ve implemented is based on the Microsoft CoE Starter Kit, backed by Dataverse and supported by a series of automated flows.
At a high level, the system is doing three things:
- Collecting telemetry across apps, flows, and environments
- Standardizing that data inside Dataverse
- Continuously updating through scheduled sync processes
What’s important here is not the setup itself — but what begins to emerge once the system is running.
What the Environment Shows
Below is a snapshot from my current CoE dashboard:
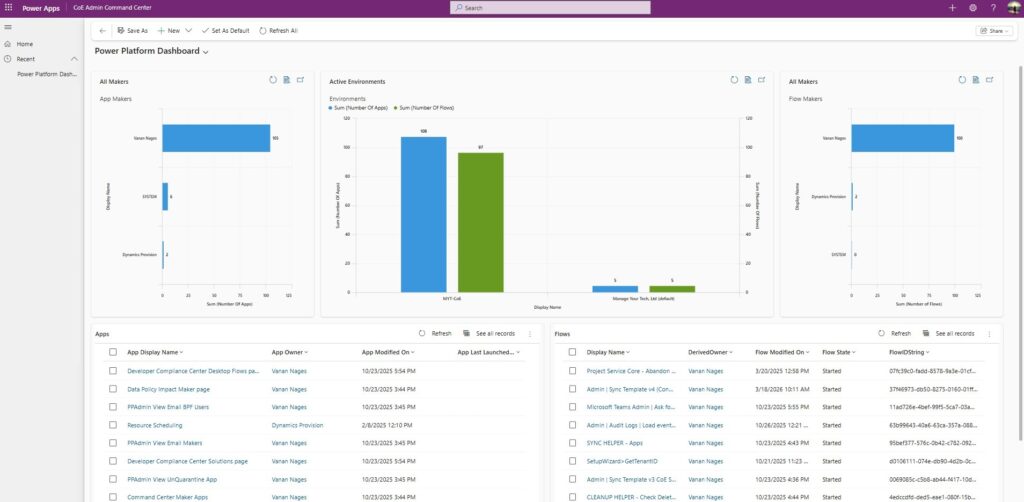
At a glance, even in a small, controlled environment, a few things become visible:
- Who is building (makers and ownership patterns)
- What exists (apps, flows, environments)
- How active the system is (recent updates, automation activity)
This is the shift from static reporting to live platform awareness.
Early Observations (Even at Small Scale)
Even in this early-stage setup, a few patterns stand out:
- A high concentration of ownership under a single maker
- Active automation flows continuing to run and update into 2026
- A relatively stable app layer with fewer recent changes
- A simple environment structure, with most activity centralized
Individually, these are just data points. Together, they start to tell a story. At this stage, the goal isn’t to control the system—it’s to understand it.
Why This Matters
In many organizations, Power Platform grows organically:
- Apps are created quickly
- Automations solve immediate problems
- Teams build independently
Over time, this leads to a familiar challenge:
“We know things are being built — but we don’t fully understand what we have.”
This is where a CoE becomes critical.
Not as a reporting tool — but as a visibility layer across the platform.
From Visibility to Understanding
At this stage, the system is doing exactly what it should:
👉 It is making the invisible visible
But visibility alone is not the end goal.
The real value comes from interpretation:
- Where are the risks?
- Where is activity concentrated?
- What is stable vs evolving?
- What requires governance attention?
This is the transition from:
data → insight → control
A Natural Next Step
This environment is still early — by design.
What comes next is not more data, but more structure around it:
- defining governance signals
- identifying risk patterns
- shaping how organizations respond to what they see
That’s where a CoE moves from:
a monitoring tool → an operating model
__________________________________________________________________________________________
In Part 3, I’ll expand this further:
- What a CoE looks like
- What organizations should actually monitor
- How governance, ownership, and lifecycle management take shape
_________________________________________________________________________________________